The presidential election is just few days away and this is the perfect time to jump into the prediction game as many others had (Nate Silver, Sam Wang, Drew Linzer, and others).

One way to estimate the outcome of the election results is to use data from polls. Many factors can be taken into consideration when performing a projection, such as historical trends, media coverage, debates, etc., but the advantage of considering polls is that it gives a data that is chronologically close to the desired event.


Red states are projected to have Trump majority.
Blue states are projected to have Hillary majority.
Yellow states have a very small difference and could swing.
This gives the projected values for electoral votes (without the Yellow states)
These projections were made with 95% confidence.

One way to estimate the outcome of the election results is to use data from polls. Many factors can be taken into consideration when performing a projection, such as historical trends, media coverage, debates, etc., but the advantage of considering polls is that it gives a data that is chronologically close to the desired event.

We can think about the election as a guessing game: How much does each candidate measure on election day? We are measuring each candidate on the population on election day and polls give a good source of information on how this measurement is currently changing. It is important to realize that these measurements are dynamic and get affected by events. Every time big polls are published, knowing the current measurement makes it to change. This is known in physical terms as the Observer Effect.
The influence of time is then important in the consideration of polling data. One way I incorporated this was by considering Markov Chains. With these, it is possible to take into account the effect of transitioning from one measurement to another, that is, the effect of one poll into another.
Given a set of polls chronologically arranged, it is then possible to estimate the dynamics of the population by considering the steady state of the Markov Chain. This can provide a good estimation of the end result of an event, as shown in my projections for the Guatemalan election last year.
This process can be done for every state using data of state polls. In some states there is more polling data which makes the estimation to have smaller error than others.
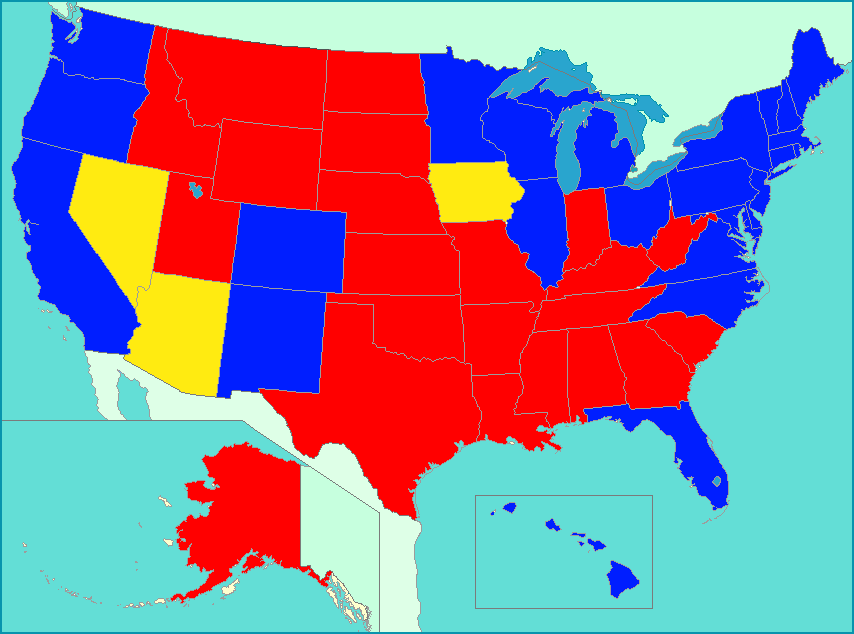
The projections then are given by the following:
| State | Hillary | Trump |
| Alabama | 27.91% | 69.63% |
| Alaska | 34.47% | 57.12% |
| Arizona | 45.35% | 46.60% |
| Arkansas | 24.62% | 70.65% |
| California | 69.25% | 25.44% |
| Colorado | 51.71% | 39.46% |
| Connecticut | 56.84% | 37.90% |
| DC | 100.00% | 0.00% |
| Delaware | 58.08% | 31.86% |
| Florida | 49.76% | 46.59% |
| Georgia | 44.54% | 51.22% |
| Hawaii | 67.44% | 20.50% |
| Idaho | 18.31% | 59.84% |
| Illinois | 64.45% | 29.92% |
| Indiana | 37.66% | 56.29% |
| Iowa | 47.07% | 46.31% |
| Kansas | 35.04% | 53.20% |
| Kentucky | 35.16% | 60.77% |
| Louisiana | 34.71% | 61.24% |
| Maine | 52.06% | 37.95% |
| Maryland | 79.63% | 15.87% |
| Massachusetts | 72.83% | 22.72% |
| Michigan | 52.89% | 38.48% |
| Minnesota | 52.08% | 40.62% |
| Mississippi | 40.05% | 58.57% |
| Missouri | 40.05% | 52.98% |
| Montana | 35.33% | 59.27% |
| Nebraska | 34.08% | 60.26% |
| Nevada | 46.37% | 47.47% |
| New Hampshire | 53.85% | 39.98% |
| New Jersey | 58.23% | 33.63% |
| New Mexico | 52.50% | 35.28% |
| New York | 69.81% | 26.39% |
| North Carolina | 49.00% | 47.42% |
| North Dakota | 29.15% | 66.80% |
| Ohio | 49.08% | 46.31% |
| Oklahoma | 25.27% | 70.30% |
| Oregon | 49.37% | 39.12% |
| Pennsylvania | 54.00% | 41.61% |
| Rhode Island | 50.86% | 38.14% |
| South Carolina | 39.23% | 56.90% |
| South Dakota | 30.89% | 62.54% |
| Tennessee | 30.77% | 65.91% |
| Texas | 35.83% | 51.45% |
| Utah | 27.55% | 47.22% |
| Vermont | 69.49% | 20.98% |
| Virginia | 55.34% | 38.36% |
| Washington | 63.04% | 25.54% |
| West Virginia | 24.43% | 69.83% |
| Wisconsin | 56.62% | 36.61% |
| Wyoming | 12.43% | 81.81% |
Red states are projected to have Trump majority.
Blue states are projected to have Hillary majority.
Yellow states have a very small difference and could swing.
This gives the projected values for electoral votes (without the Yellow states)
| Candidate | Electoral Votes |
| Hillary | 341 |
| Trump | 188 |
Comments
Post a Comment